
Our founders and our team have a long track record of developing and publishing cutting-edge visualization methods, and we continue to do research and publish it at datavisyn! Our basic research work is also often funded by public agencies, which we gratefully acknowledge.
Abstract
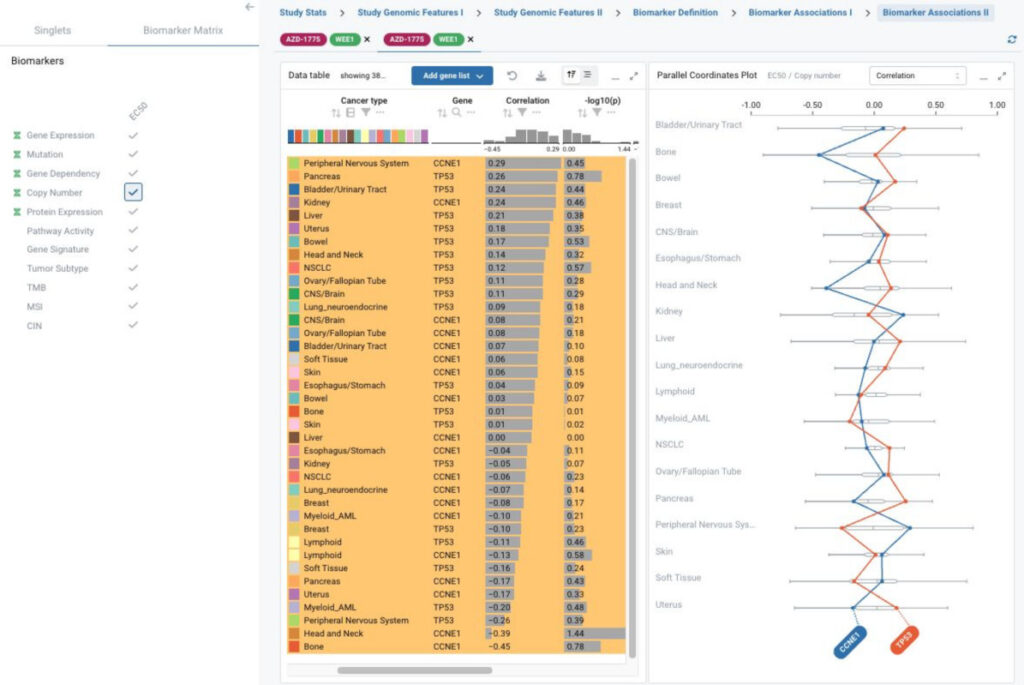
BioInsight is a unique solution to integrate large-scale pharmacogenomic data that enables biomarker exploration, validation, and discovery across preclinical models and drug screening studies from public and internal resources.
This project incorporates state-of-the-art visualization technologies with Ordino for flexible data and plot selection, and easy data comparison across screening studies and model systems.
Abstract
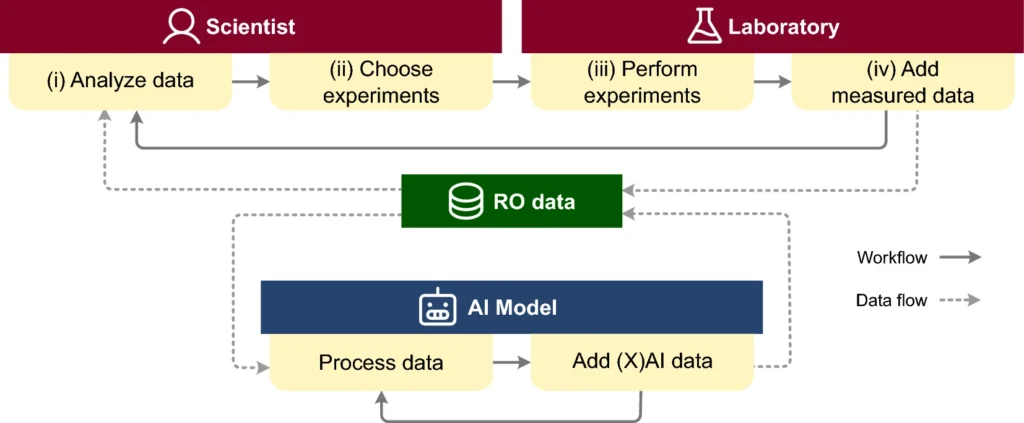
Chemical reaction optimization (RO) is an iterative process that results in large, high-dimensional datasets. Current tools allow for only limited analysis and understanding of parameter spaces, making it hard for scientists to review or follow changes throughout the process. With the recent emergence of using artificial intelligence (AI) models to aid RO, another level of complexity has been added.
Abstract
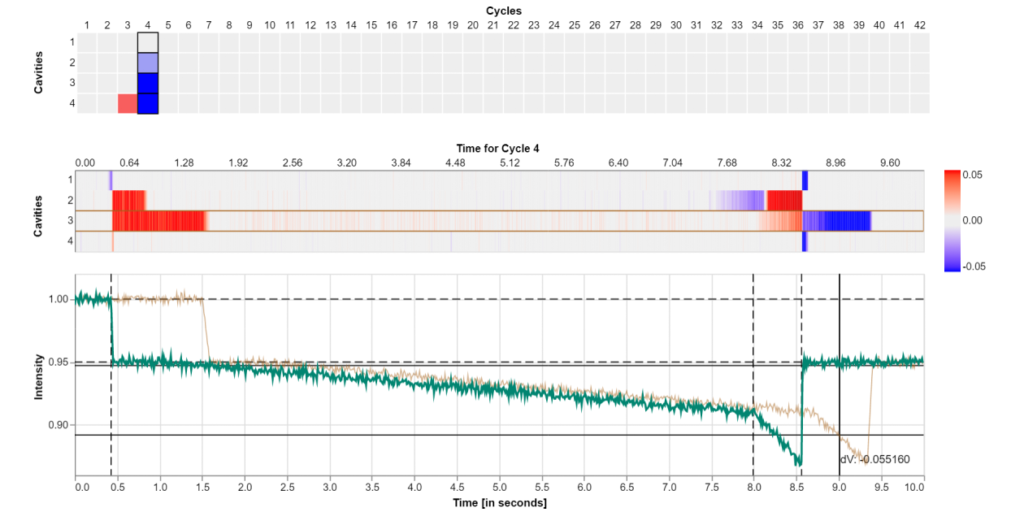
In injection molding machines the molds are rarely equipped with sensor systems. The availability of non-invasive ultrasound-based in-mold sensors provides better means for guiding operators of injection molding machines throughout the production process.
Abstract
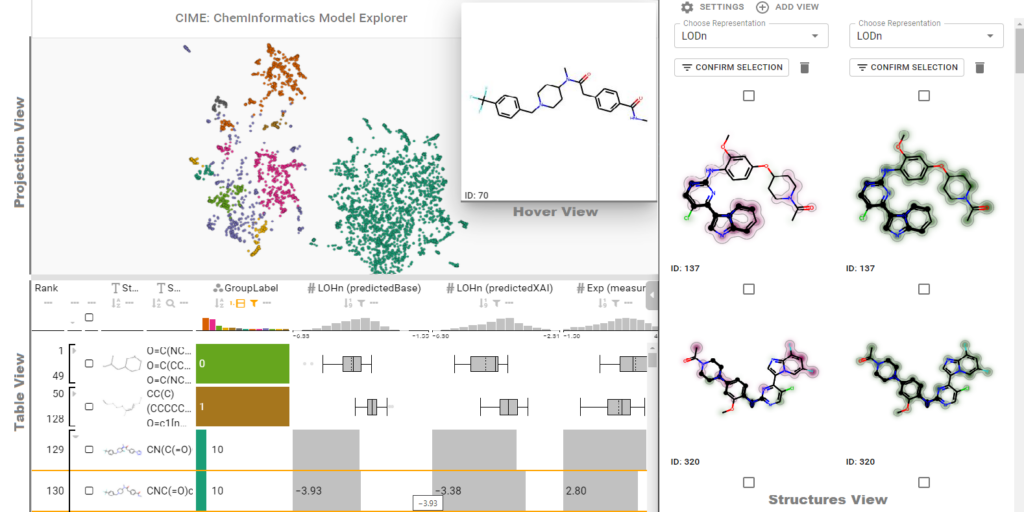
The introduction of machine learning to small molecule research– an inherently multidisciplinary field in which chemists and data scientists combine their expertise and collaborate – has been vital to making screening processes more efficient. In recent years, numerous models that predict pharmacokinetic properties or bioactivity have been published, and these are used on a daily basis by chemists to make decisions and prioritize ideas.
Abstract
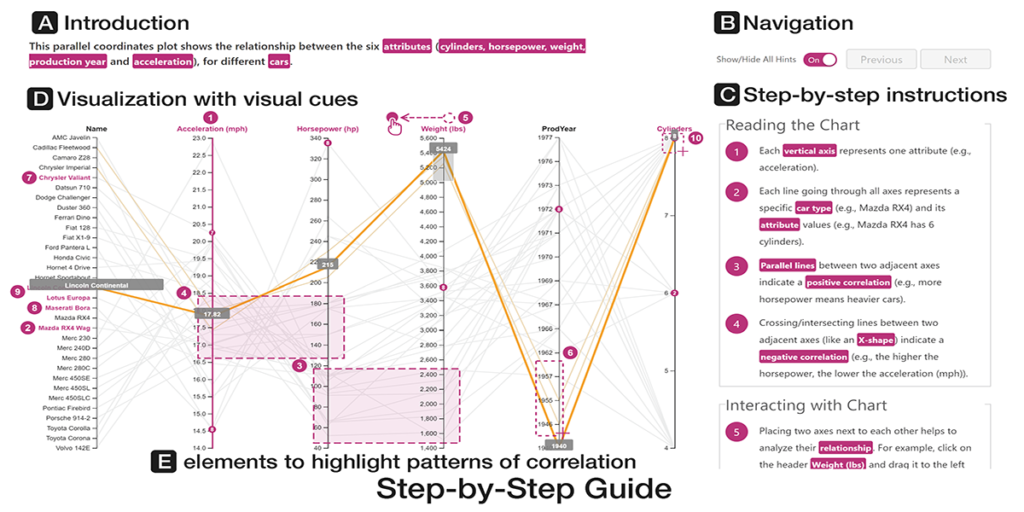
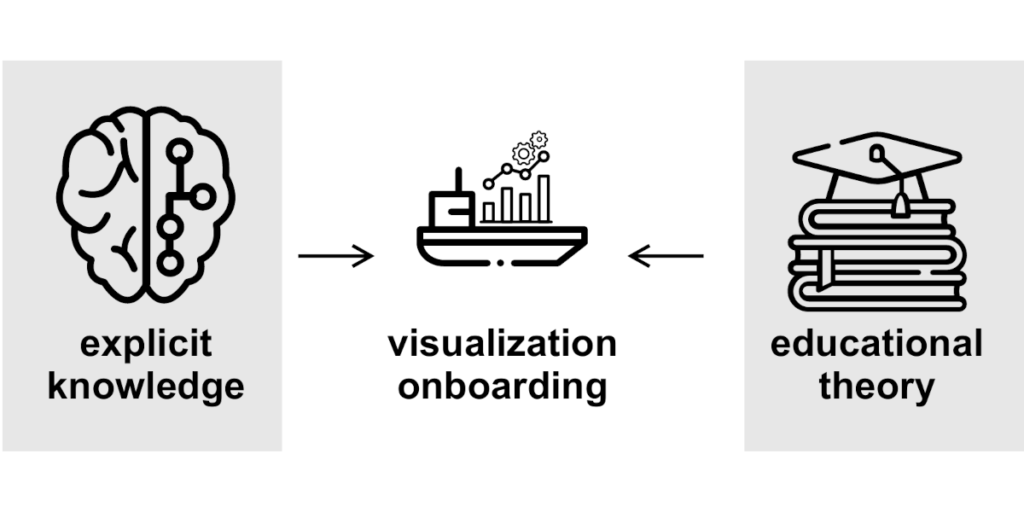
Comprehending and exploring large and complex data is becoming increasingly important for users in a wide range of application domains. Still, non-experts in visual data analysis often have problems with correctly reading and interpreting information from visualizations that are new to them. To support novices in learning how to use new digital technologies, the concept of onboarding has been successfully applied in other fields and first approaches also exist in the visualization domain.
1) Firstly, we explored the effect of vis onboarding, using an interactive step-by-step guide, on user performance for four increasingly complex visualization techniques. We performed a between-subject experiment with 596 participants in total. The results showed that there are no significant differences between the answer correctness of the questions with and without onboarding. Furthermore, participants commented that for highly familiar visualization types no onboarding is needed.
2) Second, we performed another study with MTurk workers to assess if there is a difference in user performances on different onboarding types: step-by-step, scrollytelling tutorial, and video tutorial. The study revealed that the video tutorial was ranked as the most positive on average, based on sentiment analysis, followed by the scrollytelling tutorial and the interactive step-by-step guide.
3) For our third study with students, we gathered data on users’ experience in using an in-situ scrollytelling for the VA tool. The results showed that they preferred scrollytelling over the tutorial integrated into the landing page. In summary, the in-situ scrollytelling approach works well for visualization onboarding and a video tutorial can help to introduce interaction techniques.
Abstract
The aim of visualization is to support people in dealing with large and complex information structures, to make these structures more comprehensible, facilitate exploration, and enable knowledge discovery.
Abstract
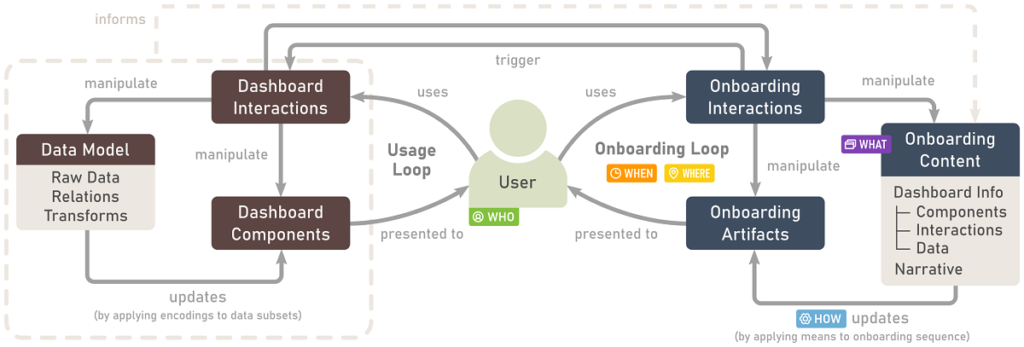
Dashboards are used ubiquitously to gain and present insights into data by means of interactive visualizations. To bridge the gap between non-expert dashboard users and potentially complex datasets and/or visualizations, a variety of onboarding strategies are employed, including videos, narration, and interactive tutorials.
Abstract
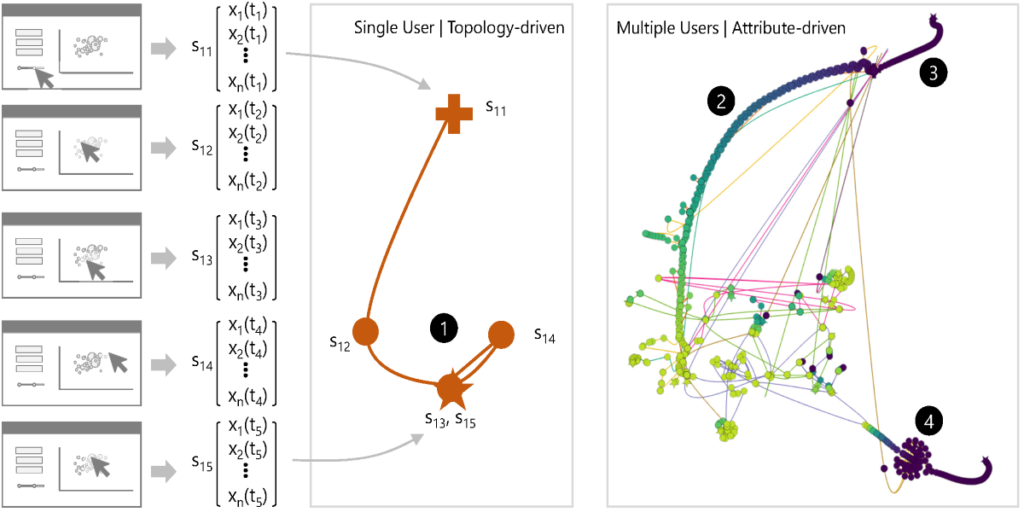
Understanding user behavior patterns and visual analysis strategies is a long-standing challenge. Existing approaches rely largely on time-consuming manualprocesses such as interviews and the analysis of observational data.
Abstract
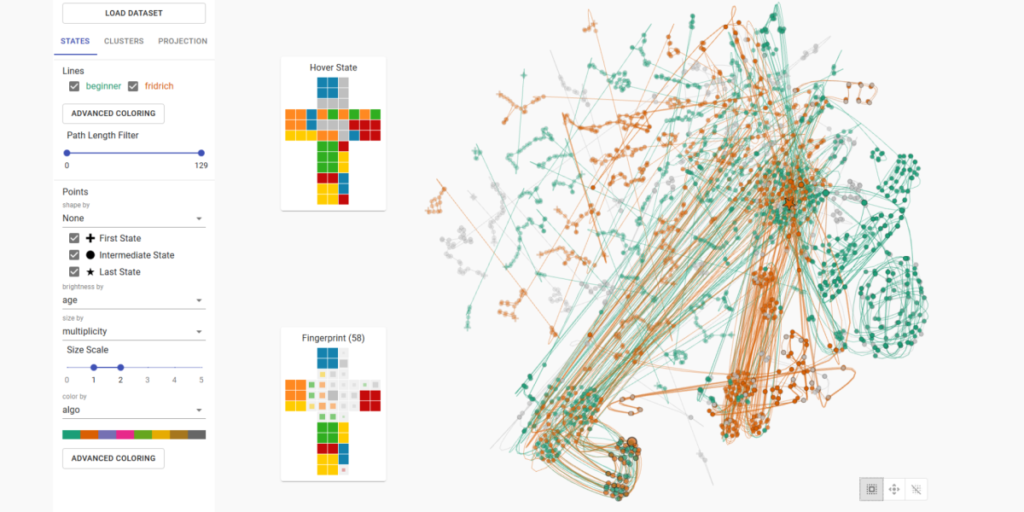
In problem-solving, a path towards solutions can be viewed as a sequence of decisions. The decisions, made by humans or computers, describe a trajectory through a high-dimensional representation space of the problem.
Abstract
Most tabular data visualization techniques focus on overviews, yet many practical analysis tasks are concerned with investigating individual items of interest.
Abstract
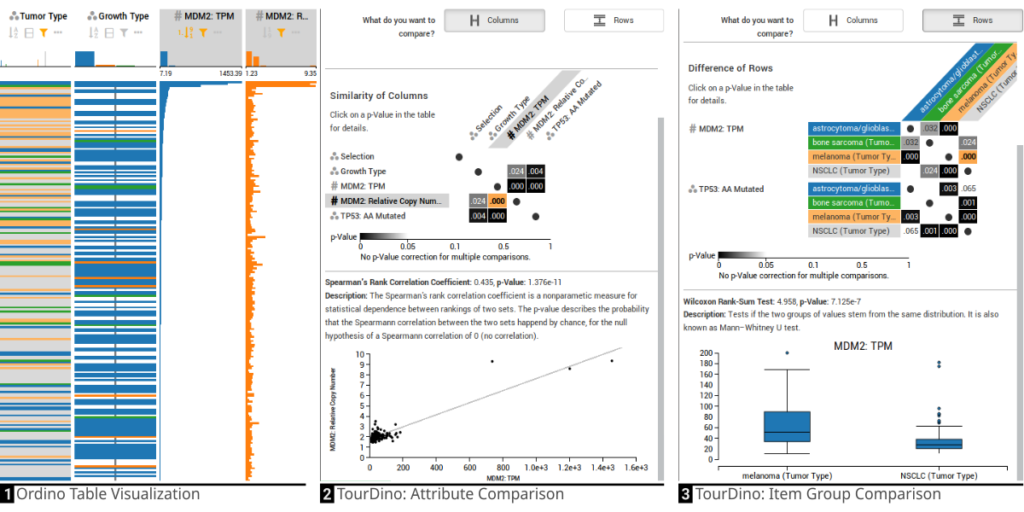
Seeking relationships and patterns in tabular data is a common data exploration task. To confirm hypotheses that are based on visual patterns observed during exploratory data analysis, users need to be able to quickly compare data subsets, and get further information on the significance of the result and the statistical test applied.
Abstract
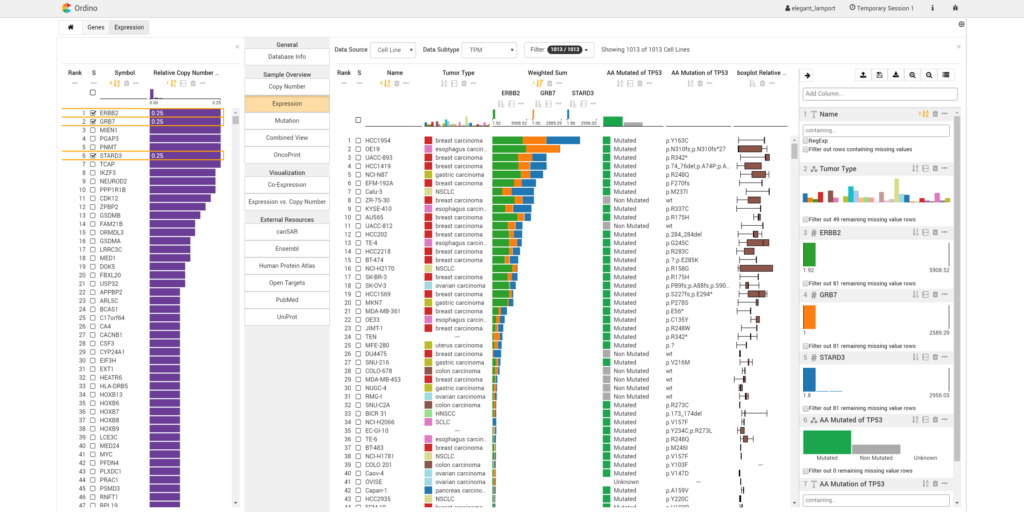
Summary: Ordino is a web-based analysis tool for cancer genomics that allows users to flexibly rank, filter and explore genes, cell lines and tissue samples based on pre-loaded data, including The Cancer Genome Atlas, the Cancer Cell Line Encyclopedia and manually uploaded information.
Abstract
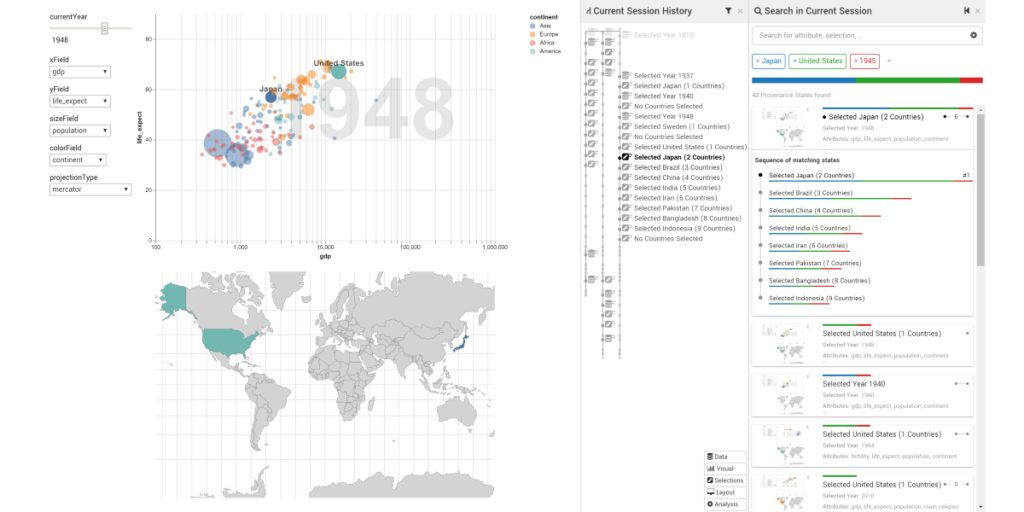
Storing analytical provenance generates a knowledge base with a large potential for recalling previous results and guiding users in future analyses.
Abstract
The primary goal of visual data exploration tools is to enable the discovery of new insights. To justify and reproduce insights, the discovery process needs to be documented and communicated.
Abstract
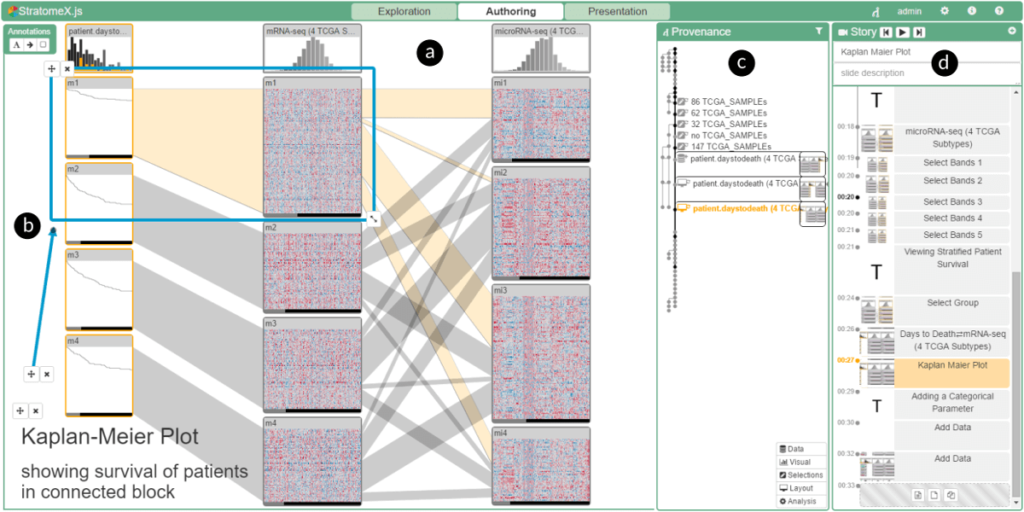
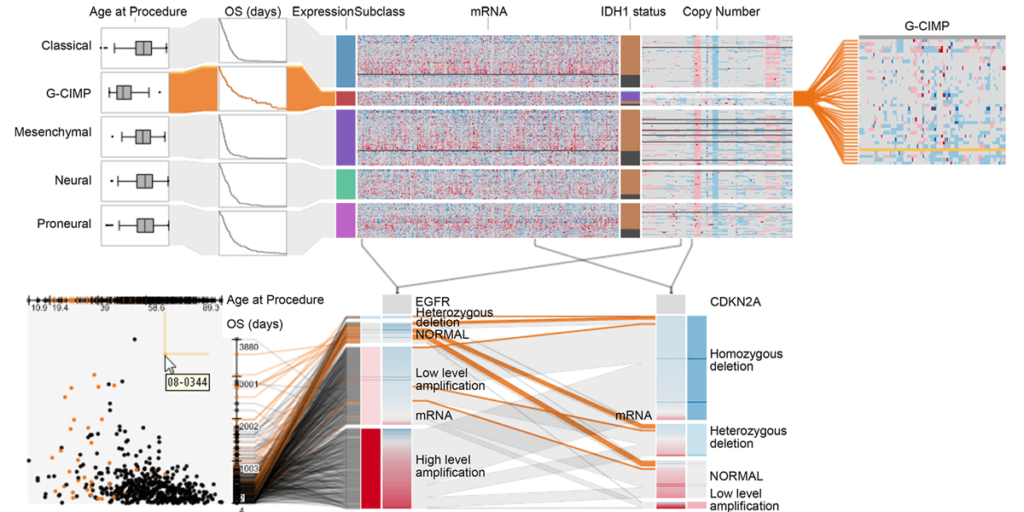
Answering questions about complex issues often requires analysts to take into account information contained in multiple interconnected datasets.
In this paper we present Domino, a novel multiform visualization technique for effectively representing subsets and the relationships between them. By providing comprehensive tools to arrange, combine, and extract subsets, Domino allows users to create both common visualization techniques and advanced visualizations tailored to specific use cases. In addition to the novel technique, we present an implementation that enables analysts to manage the wide range of options that our approach offers. Innovative interactive features such as placeholders and live previews support rapid creation of complex analysis setups. We introduce the technique and the implementation using a simple example and demonstrate scalability and effectiveness in a use case from the field of cancer genomics.
Abstract
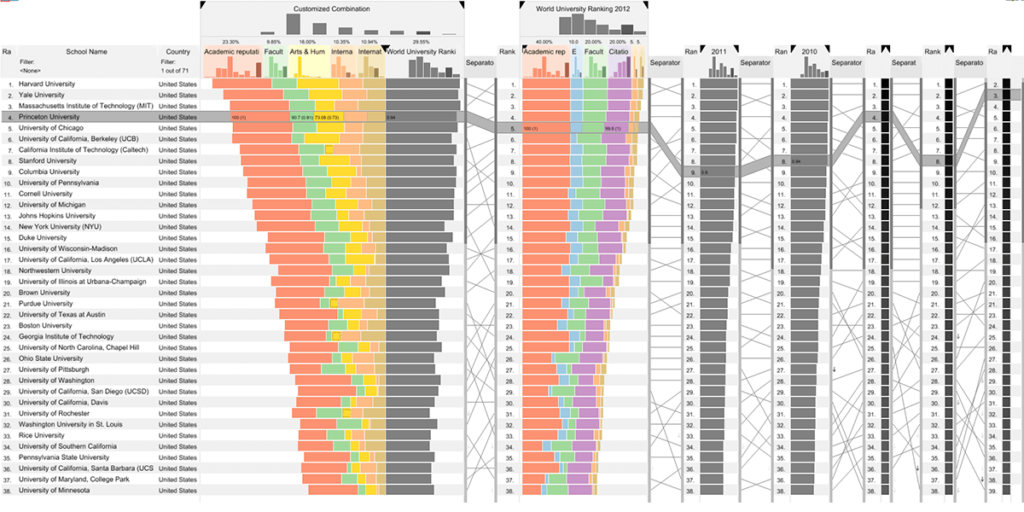
Rankings are a popular and universal approach to structuring otherwise unorganized collections of items by computing a rank for each item based on the value of one or more of its attributes.
Partners:
datavisyn GmbH
Funded by:
Austrian Research Promotion Agency (FFG)
Website:
Goal:
The pharmaceutical industry is in a reproducibility crisis. Articles from the science magazines Science and Nature prove that only a part of the results of the current publications on the subject of cancer research are understandable. At the same time, the industry is in an efficiency crisis: only 5 out of 5,000 so-called drug candidates make it to approval. The drop-out rate contributes significantly to the enormous development costs (1-3 billion USD) and duration (up to 10 years). Many of these drop-out candidates could already be recognized in the first phase of drug development: in the drug target discovery phase. In this project, systems specially tailored to biomedical research are being developed with fully integrated provenance tracking, structured validation of research results, cutting-edge visual analytics and domain-specific support. In this way, the drug target discovery phase can be designed much more efficiently and the quality of the drug candidates can be increased.
Partners:
Fachhochschule St. Pölten, Landsiedl Popper OG, Technische Universität Wien, FH JOANNEUM Gesellschaft mbH
Funded by:
Austrian Research Promotion Agency (FFG)
Website:
Goal:
SEVA aims to help people quickly learn new tools for visual data analysis. The project’s goal is to develop automatically generated onboarding methods for visual analysis systems. Appropriate onboarding methods improve the user experience and the understanding of visual data analysis tools for large and complex data sets. Proof-of-concept prototypes are methodically designed, built, and evaluated along with an iterative, user- and problem-oriented research process.